


Tech Leaders' Gross Margin Trumps Laggards - Q2 Index Update
What's the impact of digital commerce innovation?

Hi everyone,
I hope you’re enjoying your last week of summer.
We have a great Q2 update on our Distribution Tech Leaders and Laggards. Here are our two original articles introducing the index.
The first newsletter looked at pricing and valuations
Our second newsletter looked at % of digital commerce sales and gross margins
Our Distribution Leaders and Laggards Index is a proprietary index of publicly traded, billion-dollar B2B distributors across multiple verticals. Each cohort, the Leaders and the Laggards, are spread evenly across various verticals like food, building materials, industrial, healthcare and IT. The Leaders were chosen because they are at the forefront of digital commerce in their respective verticals. The Laggards were chosen because they aren’t.
We’re trying to answer the age-old question in B2B Distribution which is:
How much does digital commerce innovation really matter?
Well, we’ve refreshed the numbers – so let’s find out!
Tech Leaders Pull Away in 5 Year Stock Price Comparison

As you can see in the above graphic, we have compared the stock price of the Tech Leaders, Laggards, S&P 500 and Dow Jones over the past 5 years. Our Tech Leaders have continued to outperform the broader market. The Tech Laggards, however, have seen a substantial dip and are now underperforming the S&P 500 for the first time since early 2022. Whereas, our Tech Leaders have been level with or have outpaced all other cohorts ever since early 2021.
Correlation between Gross Margin and Valuation
As you’ll see in the below graphs where we track Gross Margin and EV/EBITDA, what seems to have the strongest correlation is the relative difference in valuation between the Leaders and Laggards and the relative difference in Gross Margin. In 2023, as the Gross Margin differential peaked at 6.2% between the Leaders and Laggards, so too did the difference in valuation at slightly over 5X (as denoted by the green spotted line in the 5 Year EV/EBITDA comparison below).
Why do the Tech Leaders maintain stronger Gross Margin over the Laggards?
This is a complicated question and there’s no single, easy answer. If your organization is proficient to engage in digital commerce, we also assume that your organization is using more modern technologies in other areas of the business as well. In other words, the skills and culture needed to be successful in digital commerce also lend themselves to operating a more efficient distribution business overall, such as in procurement. There are a number of new technologies to engage in better procurement and increase your inventory turns – our investment in Recurrency being one of many examples.
Tech Leaders Maintain Gross Margin Advantage
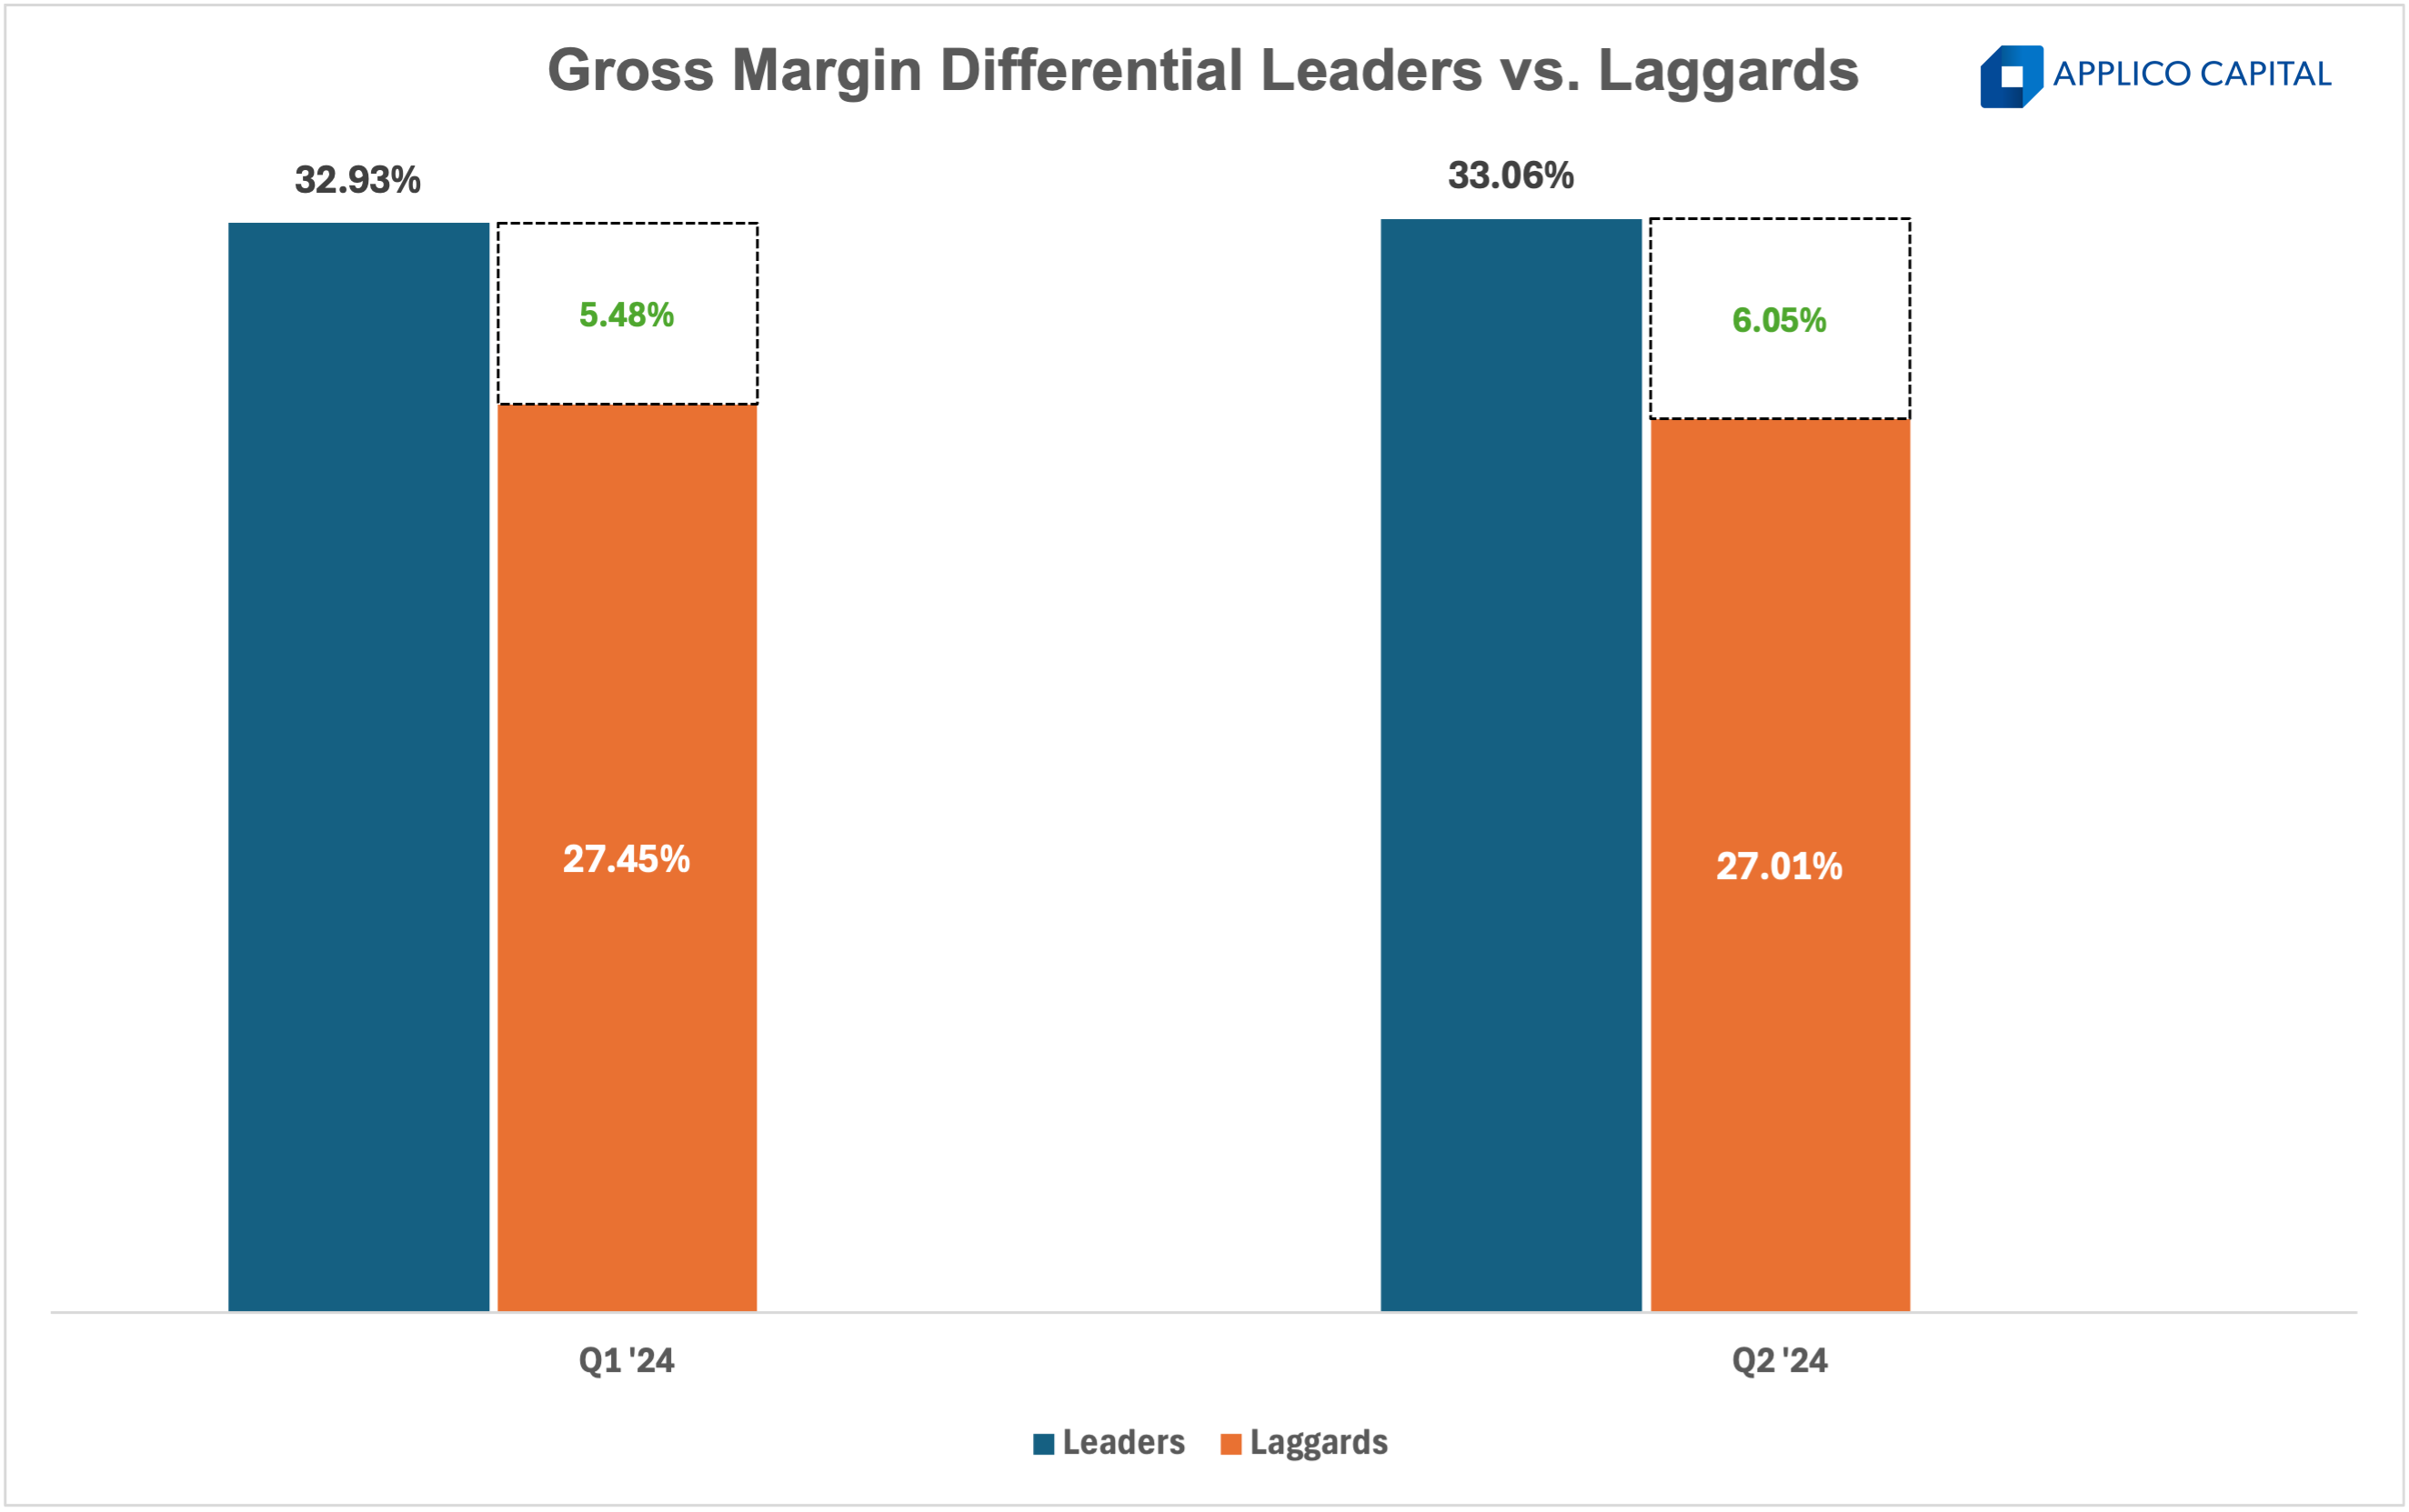
While tech leaders have maintained their stronger gross margins, our Tech Laggards have seen a modest decline over the past quarter. Interestingly, this is a reversal from what we saw in Q1, where our Laggards had narrowed the gap slightly compared to Q4 ‘23 – see below.